



Understanding the psychrometric chart is crucial for anyone involved in HVAC engineering, building system design, or environmental sciences. While digital tools like online calculators and smartphone apps offer quick solutions, mastering the psychrometric chart provides deeper insight into humidity measurement and control.
What is Humidity?
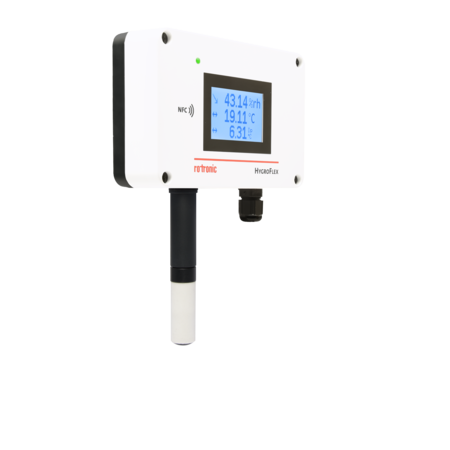
Humidity refers to the amount of water vapor present in the air. Water vapor is the gaseous form of water and is invisible, unlike liquid water droplets that form clouds, fog, or condensation. The amount of moisture the air can hold changes with temperature, with warmer air capable of holding significantly more water vapor than cooler air.
Humidity plays an important role in both human comfort and industrial processes. In HVAC systems, humidity directly affects indoor comfort, heating and cooling efficiency, and indoor air quality. In manufacturing, laboratories, data centers, museums, and food processing facilities, maintaining proper humidity levels helps protect equipment, preserve materials, and ensure consistent product quality.
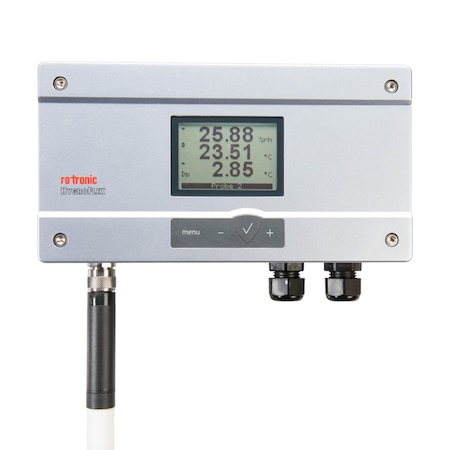
Because moisture levels can vary continuously as environmental conditions change, humidity is commonly measured and monitored using specialized sensors and transmitters that provide real-time data for environmental control systems.
What is a Psychrometric Chart?
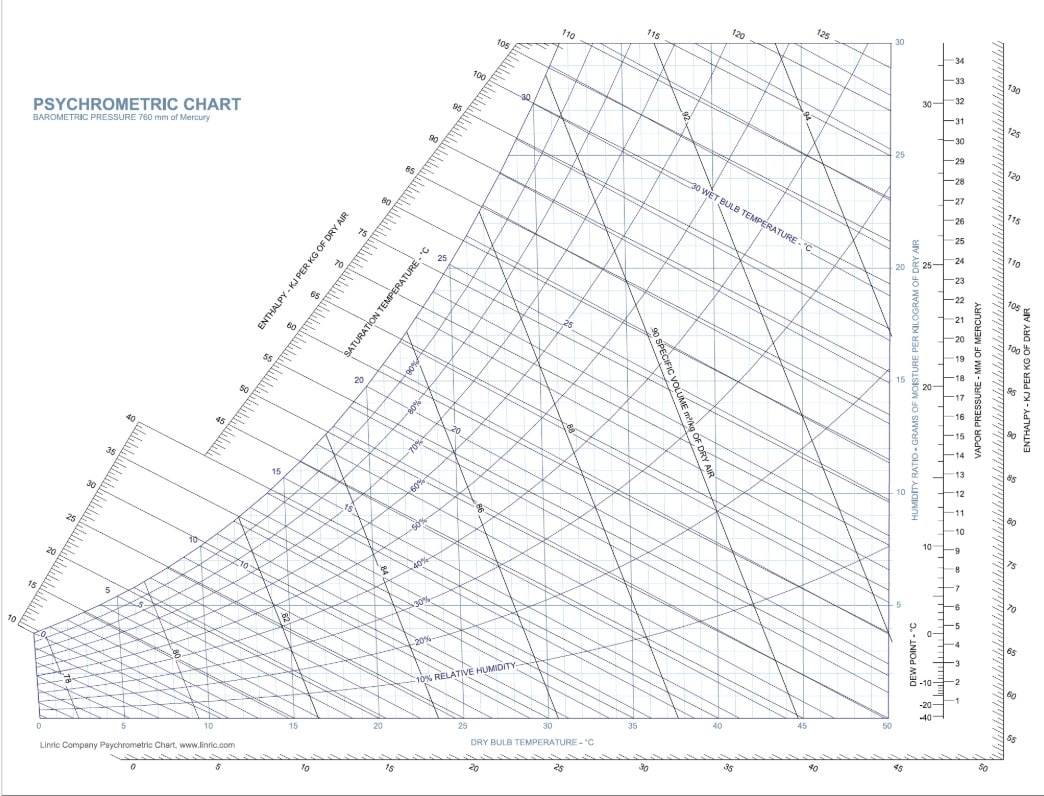
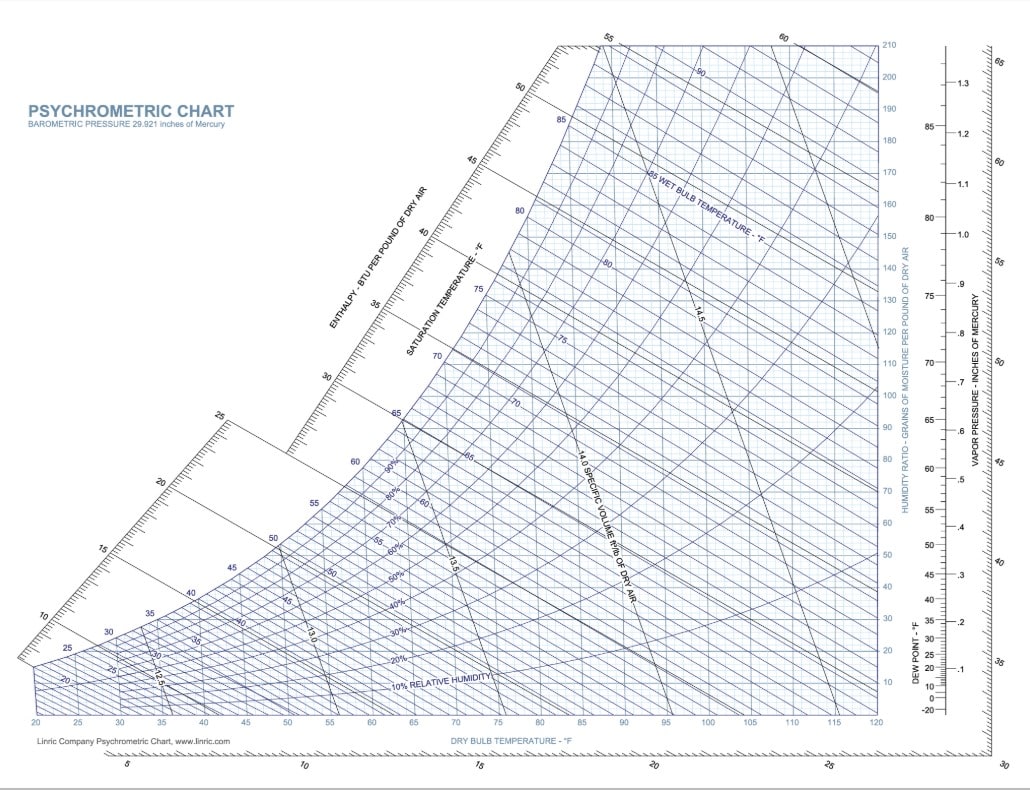
Hover over either chart to enlarge it. Click either image to view the full-size version.
A psychrometric chart is a graphical representation of the physical and thermodynamic properties of air and water vapor. It illustrates how air behaves as its temperature and moisture content change, making it one of the most valuable tools in HVAC engineering, building design, and industrial environmental control.
By knowing any two independent properties, such as dry-bulb temperature and relative humidity, nearly every other property of the air can be determined directly from the chart, allowing engineers and technicians to visualize the relationships between multiple air properties simultaneously.
The 8-Step Framework for Reading a Psychrometric Chart
Every point on a psychrometric chart represents a unique set of air conditions. By learning how to identify the chart's major axes, curves, and reference lines, you can determine numerous properties of air from just two known measurements.
The following eight steps introduce the primary properties displayed on the chart and explain how to locate and interpret each one. Together, these properties allow engineers and HVAC professionals to evaluate air conditions, analyze heating and cooling processes, and determine how changes in temperature and moisture affect the behavior of air.
Step 1: Locate the Dry Bulb Temperature
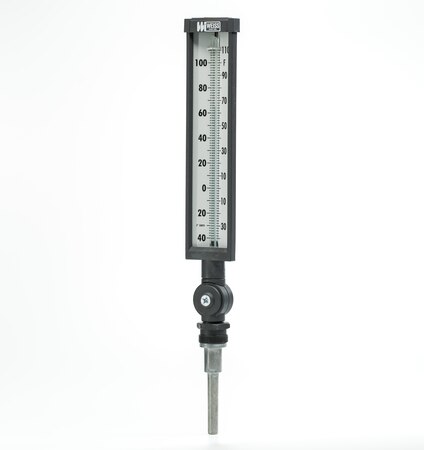
- Definition: The dry bulb temperature is the ambient air temperature measured by a standard thermometer (it is called 'dry bulb' in relation to the bulb of a traditional liquid-in-glass thermometer)
- How to Find: Look along the bottom horizontal axis of the chart, marked in degrees Celsius (°C) or degrees Fahrenheit (°F)
- Action: Draw a vertical line upward from your specific dry bulb temperature
Step 2: Locate the Humidity Ratio
- Definition: The humidity ratio (or mixing ratio) represents the mass of water vapor per unit mass of dry air
- Units: Grams of moisture per kilogram of dry air or grains of moisture per pound of dry air
- How to Find: Check the right vertical axis of the chart
- Action: Identify the corresponding humidity ratio for your measurement
Step 3: Locate the Saturation Curve
- Definition: The saturation curve indicates where the air is fully saturated (100% relative humidity)
- Location: The leftmost curved line on the chart
- Properties at Saturation:
- Relative Humidity: 100%
- Dew Point Temperature equals Dry Bulb Temperature
- Wet Bulb Temperature equals Dry Bulb Temperature
- Partial Pressure of Water Vapor equals Saturation Vapor Pressure
Step 4: Locate Relative Humidity Lines
- Definition: The humidity lines represent specific levels of relative humidity as a percentage
- Location: The interior curved lines between the dry bulb temperature axis and the saturation curve
- Action: Find the line matching your desired relative humidity
Step 5: Locate Dew Point Lines
- Definition: Dew point is the temperature at which air becomes saturated and water vapor begins to condense
- How to Find:
- Locate the vertical line labeled "Dew Point" on the right side
- Dew point lines run horizontally across the chart
- Action: Draw a horizontal line from your dew point temperature
Step 6: Locate Vapor Pressure Lines
- Definition: Vapor pressure is the pressure exerted by water vapor in the air
- Units: Millibars (mb) or inches of mercury (inHg)
- How to Find:
- Positioned next to the dew point scale on the right
- Vapor pressure lines are horizontal
- Action: Identify the vapor pressure corresponding to your conditions
Step 7: Locate Enthalpy Lines
- Definition: Enthalpy represents the total heat content of the air-water vapor mixture
- Units: Kilojoules per kilogram of dry air (kJ/kg) or british thermal units per pound of dry air (BTU/lb)
- How to Find:
- Located on the extreme edges of the chart
- Enthalpy lines run diagonally upward from left to right
- Action: Use a ruler to match enthalpy scales diagonally across the chart
Step 8: Locate Wet Bulb Temperature Lines
- Definition: The wet bulb temperature is the lowest temperature air can reach through evaporation
- How to Find:
- Diagonal lines close to but not parallel with enthalpy lines
- Expressed in °C with °F in brackets
- Action: Find the line corresponding to your wet bulb temperature
Tips and Tricks for Using the Psychrometric Chart
Knowing any two parameters allows you to determine all other properties by finding where the lines intersect, known as the state point.
Using Dry Bulb Temperature and Dew Point
Start with the Known Values
Find the State Point
- Draw a vertical line at 21.1°C (70°F) (dry bulb temperature)
- Draw a horizontal line at 10°C (50°F) (dew point)
- Mark the intersection - This is the state point
At this point, you can read:
- Relative humidity
- Wet bulb temperature
- Humidity ratio
- Enthalpy
- Vapor pressure
Determining Cooling Effect with Evaporative Cooling
Start with the Known Values
Find the State Point
- Plot the state point where the 23.9 °C (75 °F) vertical line and the 10 °C (50 °F) wet bulb line intersect
- Follow the wet bulb temperature line to the saturation curve
- Read the dry bulb temperature at the saturation point
Determine the Cooling Effect
The difference between the original dry bulb temperature and the saturation point temperature represents the effective cooling of the air.
This difference represents the maximum theoretical temperature reduction that could be achieved through direct evaporative cooling under those conditions.
Why Mastering the Psychrometric Chart Matters
Mastering the psychrometric chart enhances your understanding of air properties and their interactions. It deepens your comprehension of how different humidity parameters relate to each other, which is essential for designing and controlling HVAC systems effectively. By becoming proficient with the chart, you can make more accurate measurements, leading to better environmental control and energy efficiency in buildings. This expertise sets you apart as a professional in humidity measurement and control, giving you a significant advantage in your field.
Investing time to understand the psychrometric chart will help you make better measurements and informed decisions in your field. Whether you're an HVAC engineer, building system designer, or a student, mastering this tool is invaluable. It not only enhances your professional skills but also contributes to more efficient and effective environmental control solutions.

Was sind Schrittmotoren und Steuerungen? – Omega Engineering Einleitung zu Schrittmotoren
